
A record, and a round trip
On the evening of February 9, 1966, the Dow Jones Industrial Average closed at 995.15. It was a record, and the papers treated it as one: the market’s first real brush with the magic line of 1,000, a number that had hovered in the American imagination the way the four-minute mile once hovered over track and field.
Picture a couple in their mid-forties that week. He’s an engineer, she teaches school. The mortgage is nearly paid, and the savings sit in blue-chip stocks, the sturdy names that sponsored the evening news. They are doing everything the era asks of a careful family. Nothing about February 1966 feels dangerous. Why would it? The market just set a record.
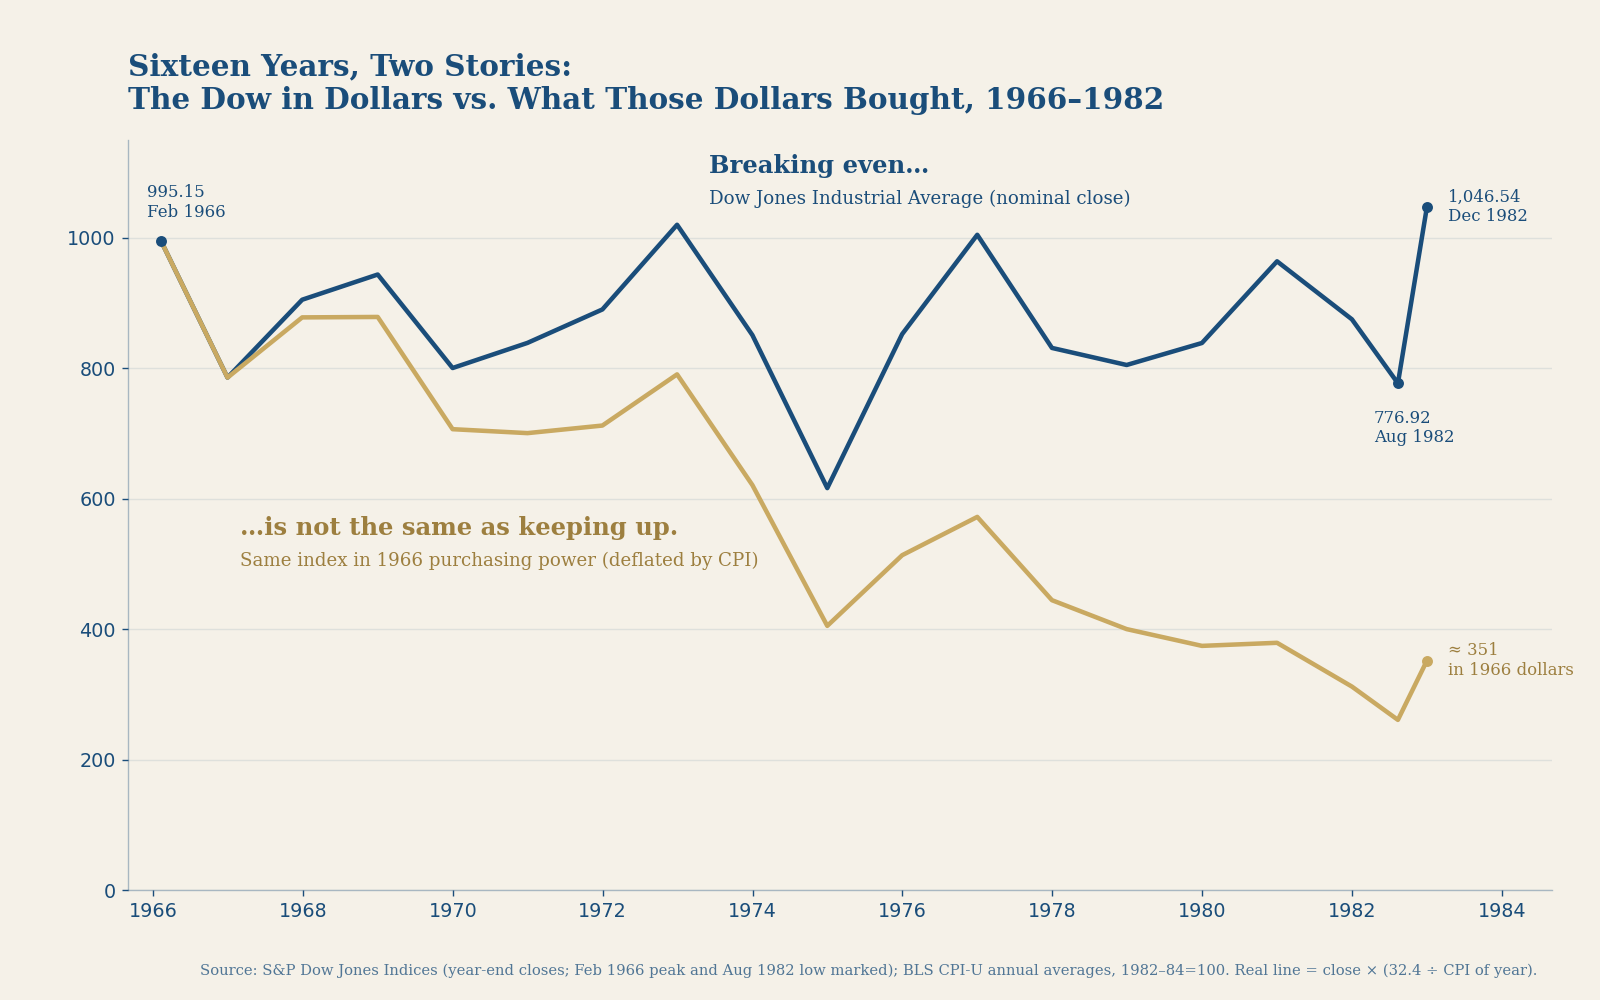
Now move the calendar forward sixteen years. On August 12, 1982, the Dow closed at 776.92. Only in the final weeks of that same year did it climb back above 1,000 and stay there. Sixteen years, round trip, ending within sight of where it began.
On paper, our couple roughly broke even. And here is the strange part: no crash headline ever announced it, because there was no single day to report. No panicked Monday, no famous photograph of traders holding their heads, no lines outside the banks. Just sixteen years of statements arriving in the mail, each one saying, more or less, that the family had held its ground.
The grocery register said otherwise. By 1982 their dollars bought roughly a third of what they had bought in 1966. We’ll get to that arithmetic shortly, and I promise it is simple. For now, hold on to the single strangest fact about the whole episode.
The crash had no crash day. That’s why nobody saw it.
The question on the kitchen table
It is July 2026 as I write this. Inflation touched a three-year high of 4.2 percent in May; by June it had eased to 3.5 percent, as the energy prices that pushed it there fell back. A new Federal Reserve chair spent the spring defending the institution’s independence while everyone argued about when interest rates should move. That is all the current events you will get from me; the Fed-independence debate is an old argument having another season, and this article has no vote in it.
What matters for our purposes is the reader’s version of February 1966. Your balance looks fine, perhaps even comfortably up. The headlines are full of records, all of them quoted in dollars. And somewhere at the kitchen table, a question forms: my balance is fine, but am I fine?
Let me say something plainly, because a historian owes you plainness: nobody, least of all me, is predicting a rerun of the 1970s. The circumstances differ, the institutions differ, and forecasting is a vice I gave up along with strong opinions about hemlines. History here is a measuring lesson, not a forecast. The 1966 couple can’t tell you what markets will do next. They can teach you how to read your own mail.
And your mail, as it happens, is very good at counting your dollars and entirely silent about weighing them.
Two numbers, one shown
Every investment carries two returns. The nominal return is the change in the dollar count: you had ten thousand, now you have eleven. The real return is the change in what those dollars buy. The first number is on every statement, every app, every headline. The second appears almost nowhere.
This is not a conspiracy. It is a convention. The dollar count is objective and easy to print; the real figure requires choosing a price index and doing a subtraction, and no brokerage is eager to mail you a smaller number than it has to. So the convention persists.
Which means the 1966 couple’s error was not bad investing. They owned good companies and held them patiently. Their error was reading the only number they were shown.
Here is what the unshown number was doing. According to Bureau of Labor Statistics data, the consumer price index averaged 32.4 in 1966 and 96.5 in 1982. Prices nearly tripled. A dollar in 1982 bought about what 34 cents had bought in 1966. So a portfolio that traveled sixteen years and landed on the same dollar figure had quietly surrendered close to two-thirds of its purchasing power.
Breaking even is not the same as keeping up. That sentence is the entire article. Everything else is supporting detail.
The quietest tax
Why did this happen? Not because anyone set out to fleece schoolteachers. Mechanisms, not villains, are the historian’s stock in trade, so let’s look at the mechanism.
The backdrop: through the late 1960s, Washington chose to fund the Vietnam War and the Great Society programs largely through deficits rather than new taxes. It was, as the hard-money writers like to note, a large war Americans were never asked to sacrifice for, at least not visibly. Meanwhile, as the economists Michael Bordo and Hugh Rockoff describe it, the Federal Reserve of that era consistently put low unemployment ahead of stable prices, and kept doing so until Paul Volcker reversed course at the end of the 1970s.
Now the incentive, stated calmly. A legislated tax requires a vote, a name attached to a bill, and a public fight. Inflation collects quietly, from everyone holding dollars, with no roll call. That is why, across centuries, it has been the politically easiest tax. Not because officials are wicked, but because the path of least resistance is genuinely less resistant. Water finds the downhill route without holding a meeting about it.
And nobody rings a bell, because there is no bell to ring. Inflation has no single decision point and sends no invoice. Its effects arrive as rising prices, which people naturally blame on grocers, oil producers, and unions rather than on a shrinking unit. Even the oil shock carried this signature. Defending OPEC’s price increases in 1973, the Shah of Iran told the New York Times: “Of course [the world price of oil] is going to rise... You increased the price of wheat you sell us by 300 percent, and the same for sugar and cement.” The sellers of oil, in other words, had noticed something about the dollar that the holders of dollars had not.
The arithmetic
Now the numbers, all recomputed from the primary records rather than borrowed from anyone’s book.
The Dow closed at 995.15 on February 9, 1966. It did not close above 1,000 until November 14, 1972, when it finished at 1,003.16, and even that visit didn’t hold. On August 12, 1982, it closed at 776.92. Only in late 1982 did it cross 1,000 for good, ending the year at 1,046.54. Sixteen years, ending roughly where it started.
Over those same sixteen years, Bureau of Labor Statistics figures show consumer prices multiplying by nearly three: the CPI’s annual average went from 32.4 to 96.5. That works out to inflation of roughly 7 percent a year, compounded. Bordo and Rockoff, dating the era slightly differently, round it to about 6 percent for 1965 through 1982.
Put the two records together. An investor whose portfolio tracked the Dow and came out flat kept about 34 cents of each 1966 dollar. That is a real loss of roughly two-thirds. In kitchen terms: $10,000 held even from 1966 to 1982 came out worth about $3,400 in 1966 dollars. One caveat belongs right here: the Dow is a price index and ignores dividends. That is a fair rebuttal, and it gets a full hearing below.
The scholarship has a name for this stretch: the Great Inflation, running 1965 to 1982, a distinct monetary regime that ended under Volcker and gave way to the Great Moderation, when inflation fell back toward 2.5 percent. The catchier label, the Invisible Crash, comes from the hard-money literature, notably Mike Maloney. The label is his; the numbers above are the government’s and the Dow’s own.
One more figure, date-stamped as it deserves. In The Ascent of Money, Niall Ferguson noted that the dollar lost about 87 percent of its purchasing power between 1957 and 2008. Run the same computation through 2025 and it reads about 91 percent. Over any single year the erosion is invisible. Over a working lifetime it is the biggest number on the statement nobody prints.
The fair hearing
If your brother-in-law reads index-fund forums, he has three replies ready. All three are good ones, so let’s give them the floor.
First: stocks eventually won, massively. True, and worth saying plainly. From that August 1982 low of 776.92, the Dow rose more than 1,400 percent to its January 2000 close, one of the great bull markets in history. Anyone who stayed invested and kept buying through the barren years was ultimately rewarded, handsomely. The Invisible Crash is an argument about measurement, not against stocks.
Second: dividends softened the blow. Also true. The Dow figure is a price index, and dividend yields in that era were substantial. With dividends reinvested, the real outcome for a patient investor was far less grim than the two-thirds figure, roughly flat to modestly negative in real terms rather than catastrophic.
Third: nobody buys the exact top and sells the exact bottom. A steady contributor through those years was buying cheap shares the whole way down, the very shares that made the post-1982 fortune. Dollar-cost averaging genuinely blunted the era’s damage.
Here is what strikes me about all three replies: each one is correct, and not one of them appears on a statement either. Dividends, contributions, patience. You only know what they did for you if you measure them. The counterarguments don’t weaken the habit this article is teaching. They are three more reasons to have it.
The shrinking ruler
The deeper lesson of 1966 to 1982 is that the ruler itself was shrinking, and one way historians see this clearly is to price the Dow, for a moment, in something other than dollars.
In February 1966, with gold officially fixed at $35 an ounce, the Dow was worth about 28 ounces of gold. On January 21, 1980, the day gold touched its $850 peak, the Dow closed at 872.78 — the whole index was worth barely more than a single ounce. The same thirty-stock index. Measured in dollars, the Dow went sideways. Measured in ounces, it fell off a cliff.
Before anyone reaches for a conclusion: this is not a suggestion to buy gold. Gold is a violent measuring stick with its own cautionary history; the people who bought it at that 1980 peak waited about 28 years to break even. The point is smaller and more useful. Any single unit of measure can mislead you, and the dollar is a unit of measure.
You don’t need gold to apply the lesson. There is an everyday second ruler, published monthly, free of charge. Which brings us to the practical part.
One evening a year
Here is the habit, and it costs one evening a year. Pick a date. The statement that arrives after New Year’s works nicely.
Step one: compute your portfolio’s return. This year’s balance, minus last year’s balance, minus whatever you contributed during the year, divided by last year’s balance. Contributions matter; skipping them flatters the result.
Step two: subtract the year’s CPI inflation rate, which is one search away at bls.gov. What remains, approximately, is your real return.
A worked example at this year’s numbers: a balance that grew 3 percent in a year with 3.5 percent inflation earned a real return of about minus half a percent. Not a disaster. A fact. But over five years, small gaps compound quietly, and that quiet compounding was the entire mechanism of 1966 to 1982.
Yes, the CPI is an approximate ruler. An approximate ruler beats no ruler.
And let me be clear about what this habit is not. It is not a reason to sell anything, buy anything, or rearrange anything. PlainMoney doesn’t do allocation advice, and neither do I. The habit’s only output is an honest number. The families of 1966 lacked a number, not virtue.
A flat portfolio during inflation is not a preserved portfolio. Now you’ll know whether yours is.
The number nobody printed
Return, finally, to our couple. They were never lied to. They were shown the wrong number, and nobody taught them to ask for the right one. Their statements were accurate to the penny and silent about the pennies’ weight.
You now know what an entire generation of savers wasn’t told, and it will cost you one evening a year to keep knowing it. That seems like a fair exchange.
I’ll repeat the disclaimer on my way out, because it bears repeating: nothing here predicts a rerun of the 1970s. Rulers, not forecasts. The next sixteen years may be generous, stingy, or dull, and I claim no knowledge of which.
But whatever they are, measure them. Of all the things a saver can own, the calmest is an honest number.
Keep Reading
Get the free book
PlainMoney readers start with Edmund Mercer’s free book, Why I Walked Out of My Financial Advisor’s Office — and get one calm, plain-English read on money and history every day.